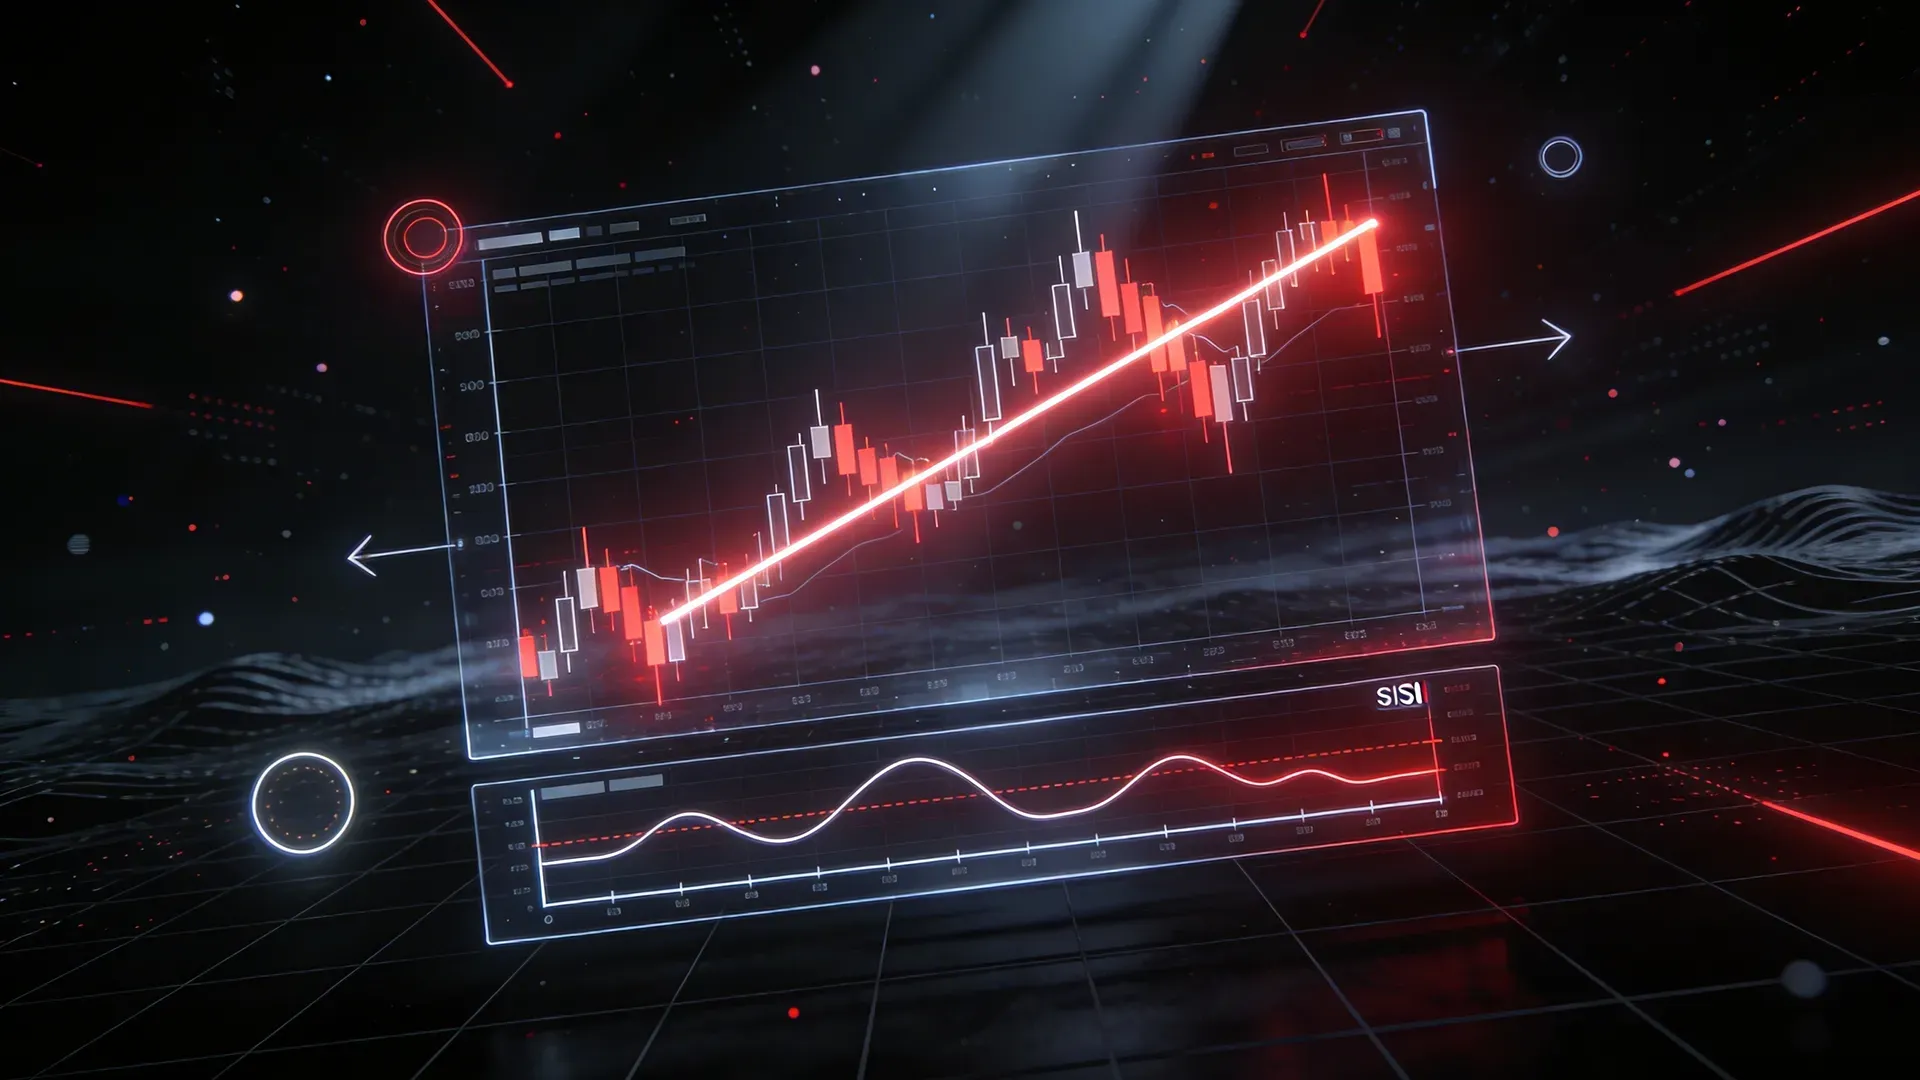
Technical analysis is the language of price. Every chart tells a story — where the market has been, where it’s headed, and where the key battles between buyers and sellers are happening. Learning to read that story doesn’t require a finance degree. It requires understanding a handful of core concepts and practicing them consistently.
This guide covers the five foundational elements of chart reading that every crypto trader needs. These are the same tools that Binance Killers analysts use to generate 1-3 VIP signals daily with 92%+ accuracy.
1. Candlesticks: The Building Blocks
A candlestick represents price movement over a specific time period. The body shows the opening and closing prices. The wicks show the highest and lowest prices reached. A green (bullish) candle means the price closed higher than it opened. A red (bearish) candle means it closed lower. Key patterns: Doji (indecision), Hammer (potential reversal at support), Engulfing (strong momentum shift). You don’t need to memorize 50 patterns. Understanding these three gives you a massive edge over traders who only watch numbers.
2. Support and Resistance: Where Price Reacts
Support is a price level where buying pressure tends to emerge, preventing the price from falling further. Resistance is where selling pressure appears, capping upside movement. These levels form because of collective market memory — traders remember where they bought or sold previously and react when price returns to those levels. How to identify them: look for price levels that have been tested multiple times without breaking. The more times a level holds, the stronger it is. When a level finally breaks, support often becomes resistance and vice versa.
3. Moving Averages: The Trend Filter
Moving averages smooth out price noise and show the underlying trend direction. The two most important for crypto: the 50-period MA (medium-term trend) and the 200-period MA (long-term trend). When price is above both, the trend is bullish. When below both, the trend is bearish. The Golden Cross (50 MA crosses above 200 MA) is a powerful bullish signal. The Death Cross (opposite) is bearish. BK’s daily analysis always includes these levels because they frame every trade decision.
4. RSI: Measuring Momentum
The Relative Strength Index (RSI) measures how quickly price is moving and whether a coin is ‘overbought’ or ‘oversold.’ RSI ranges from 0 to 100. Above 70 = overbought (potential pullback). Below 30 = oversold (potential bounce). But RSI alone isn’t a buy/sell signal. Use it in combination with support/resistance and moving averages. An RSI below 30 at a strong support level is a much higher-probability buy than RSI below 30 in a free-falling market with no support nearby.
5. MACD: Confirming Trend Changes
The MACD (Moving Average Convergence Divergence) shows the relationship between two moving averages. When the MACD line crosses above the signal line, it’s bullish momentum. When it crosses below, bearish. MACD divergence — where price makes a new high but MACD doesn’t — is one of the most reliable reversal signals in crypto. Signalize AI (@SignalizeAIBot) calculates RSI, MACD, moving averages, volume trends, and Bollinger Bands automatically for any coin you analyze, saving hours of manual chart reading.
Putting It All Together
No single indicator works in isolation. The most reliable trade setups occur when multiple signals align: price at a support level (support/resistance) + trend is bullish (moving averages) + RSI is oversold + MACD is turning up. At Binance Killers, every VIP signal considers all of these factors and more — fundamental catalysts, market sentiment, and volume analysis. The reasoning is shared alongside the signal so you learn while you trade.
Binance Killers provides educational market analysis and informational content only. Nothing here constitutes financial advice. All trading involves significant risk. Past performance does not guarantee future results. You are solely responsible for your own trading decisions.